Climbing rope specs often look confusing. Two ropes can appear very different—40 kN vs 23 kN strength, 2% vs 1.2% elongation—yet feel nearly the same in the tree.
That’s because the most commonly published elongation figure, “elongation at 10% MBS,” is tied to the rope’s breaking strength, not to how a climber actually loads the line. For example, consider how a 40 kN rope tested at 10% MBS is pulled to 4 kN, while a 23 kN rope tested at 10% MBS is pulled to 2.3 kN. Naturally, the stronger rope stretches more—it's being tested under a much higher force.
However, in practice, arborists don’t apply 4 kN to a climbing line.
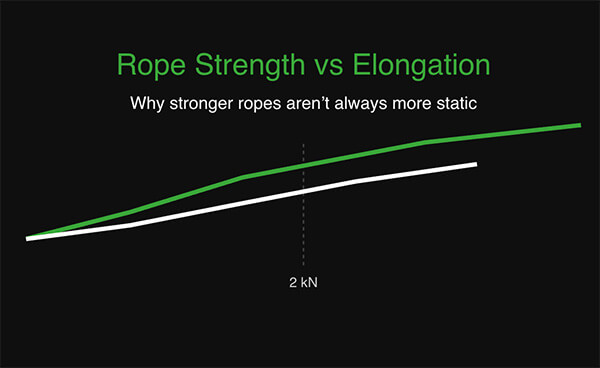
Instead, a climber’s weight averages about 1 kN with gear. Bigger load spikes—up to 2 kN+, sometimes more—happen with peak-force events: a slip, swing, step-up, or SRS ascent bounce. These loads are brief, not sustained.
When you normalize elongation to those real-world forces, you’ll see that the differences between ropes shrink dramatically.
For example, scale a 40 kN rope’s 2% at 4 kN down to a 2 kN peak, and you end up with roughly 1.1%. A 23 kN rope that lists 1.2% at 2.3 kN comes in at about the same. As a result, the numbers that looked so different on the spec sheet converge once you adjust them to what arborists actually generate in the canopy.
So, what really drives the “feel” of a climbing line? The answer is construction, not the elongation at 10%. Braid density, sheath firmness, parallel vs braided cores, yarn finish, and hardware compatibility all matter far more to how a rope behaves under foot. Remember, the 10% MBS elongation spec is a manufacturer’s benchmark, not a climbing line performance indicator.
Bottom line:
Stronger ropes aren’t stretchier—they're just tested harder. Don’t be misled by spec sheet numbers; focus on construction for performance.
How to use the elongation calculator
To translate a rope’s lab-tested elongation into something meaningful in the canopy, start by entering its MBS and elongation-at-10% values. Next, choose a realistic peak force—2 kN is a good average for brief slips, sit-backs, swings, or SRS bounce. The anchor-friction setting lets you model how much of that force actually reaches the rope: a pulley transmits almost the full load, while a natural crotch can absorb more than half of it. The calculator scales the published test data down to these real in-tree loads and shows you the resulting stretch per metre and across the full rope length. This approach offers the most accurate way to compare ropes on equal terms and understand what you’ll actually feel in the tree. (you will also find the Elongation Calculator on each of the Climbing Line product pages).
Rope Elongation Calculator
Estimate rope stretch under realistic climbing loads. Adjust for anchor friction to model true in-tree behaviour.